Liquidity ThermometerThis is a universal indicator that assesses market liquidity based on five key market parameters: volume, volatility, candlestick range, body size, and price momentum.
The indicator does not use open interest data and is suitable for all markets, including spot, futures, and Forex.
This indicator normalizes each metric historically and creates a composite index between 0 and 1, where higher values correspond to a stable and calm market environment, and lower values indicate periods of increased risk and potential liquidity stress.
LT generates an integral liquidity index in the range based on five normalized components:
-nVol — normalized volume, reflecting trading density and activity.
-nATR — the volatility component (ATR), inverted, as high volatility is typically associated with declining liquidity.
-nRange — the normalized candlestick range, also inverted to assess the structural narrowness of the price movement.
-nBody — the normalized candlestick body size (|close − open|), inverted to assess the balance of supply and demand.
-nMove — the normalized value of the price impulse movement (|Δclose|), reflecting short-term price spikes.
Each metric is linearly normalized over a sliding window (200 bars) using the formula:
norm(x) = (x − min) / (max − min),
where at max = min, the value is fixed at 0.5 to ensure stability.
The ALT index is calculated as a weighted combination:
ALT = 0.35 nVol + 0.20 (1 − nATR) + 0.20 (1 − nRange) + 0.15 (1 − nBody) + 0.10 (1 − nMove)
The result is further smoothed using EMA(3) to reduce micronoise.
Red Zone (MLI < 0.25) — Risk, Thin Liquidity
When the indicator falls into the red zone, it means the market is extremely volatile:
Characteristics:
Low volume — small trades have a strong impact on the price.
High volatility — candlesticks rise or fall sharply.
Wide candlestick range — the market is "breathing heavily," easily breaking price extremes.
Impulsive movements — small market shocks lead to sharp spikes.
Thin liquidity — few orders in the order book, large orders "eat up" the market.
What this means for a trader:
🔥 High risk of spikes and false breakouts.
⚠ Possible series of liquidations on leverage.
❌ It is not recommended to enter long or short positions without a filter or protection.
✅ Can be used for short scalping strategies if you know the entry point, but very carefully.
Green Zone (MLI > 0.75) — High Liquidity, Safe Zone
When the indicator rises into the green zone, it means the market is stable and balanced:
Characteristics:
High volume — the market is deep, orders are executed without a strong impact on the price.
Low volatility — candlesticks are stable, no sharp spikes.
Narrow candlestick range — price moves calmly.
Weak impulse movements — no sharp surges.
Sufficient liquidity — the market can handle large orders.
What this means for a trader:
✅ Safe zone for opening positions.
🔄 Easier to set stop-loss and take-profit orders.
💡 You can trade both up and down, the risk of sharp movements is minimal.
⚡ Under these conditions, there is a lower risk of spikes and accidental liquidations.
It does not predict price movements or guarantee results. It is an analytical tool intended for additional research into market structure.
[i]price

Average Price BUY-SELL_Bulent-V2Tracking prices that you have defined and trigger the crossing of them

Normalised Volume Oscillator [BackQuant]Normalised Volume Oscillator
A refined evolution of the Klinger Volume Oscillator, rebuilt for clarity, precision, and adaptability. This tool normalizes volume-driven momentum into a bounded scale so you can easily identify shifts in accumulation and distribution across any asset or timeframe, while keeping readings comparable between markets.
What this indicator does
The Normalised Volume Oscillator quantifies the balance between buying and selling pressure using the Klinger Volume Oscillator (KVO) as its base, then rescales it dynamically into a normalized range between -0.5 and +0.5. This normalization allows traders to interpret relative strength and exhaustion in volume flow, rather than dealing with raw unbounded values that differ across symbols.
It is a momentum-volume hybrid that reveals the strength of trend participation: when buyers dominate, normalized readings rise toward +0.5; when sellers dominate, they fall toward -0.5. The midline (0) acts as an equilibrium between accumulation and distribution.
Core components
Klinger Volume Oscillator: The foundation of this indicator, combining volume with price trend direction to measure long-term money flow relative to short-term movement.
Normalization process: The raw KVO is scaled over a user-defined Normalisation Period , computing `(KVO - lowest) / (highest - lowest) - 0.5`. This centers all readings around zero, allowing overbought/oversold detection independent of asset volatility or volume magnitude.
Signal moving average: The normalized KVO is smoothed with a user-selectable moving average type—SMA, EMA, DEMA, TEMA, HMA, ALMA, and others. This becomes the signal line for confirmation of trend direction or mean-reversion setups.
How it works conceptually
1. The KVO detects when volume supports price movement (bullish) or diverges from it (bearish).
2. The script normalizes the raw KVO so that relative magnitude is consistent—what is “strong buying pressure” looks the same on BTCUSD as it does on AAPL.
3. Overbought and oversold regions are derived statistically, rather than from arbitrary values, based on percentile zones around ±0.4 and ±0.5.
4. The oscillator is optionally combined with a moving average to help identify crossovers, momentum shifts, and divergence confirmation.
How to interpret it
Above 0: Indicates dominant buying pressure and likely continuation of upward momentum.
Below 0: Suggests dominant selling pressure and potential continuation of downward movement.
Crosses of 0: Often mark transitions between accumulation and distribution phases.
+0.4 to +0.5 zone: Overbought region where buying intensity is stretched; watch for deceleration or divergence.
[-0.4 to -0.5 zone: Oversold region indicating panic or exhaustion in selling.
Signal-line crossover: A traditional momentum confirmation method; when the normalized KVO crosses above its moving average, buyers regain control, and vice versa.
Why normalization matters
Typical volume oscillators are asset-specific—what is considered “high” volume for one symbol is not the same for another. By dynamically normalizing KVO values within a rolling lookback, this version transforms raw amplitude into a standardized scale. This means you can:
Compare multiple assets objectively.
Set consistent alert thresholds for overbought/oversold regions.
Avoid misleading interpretations from absolute oscillator values.
Customization and UI
Moving Average Type & Period: Select your preferred smoothing method (SMA, EMA, TEMA, etc.) and adjust its period to tune sensitivity.
Normalisation Period: Defines how many bars the KVO range is measured over; shorter periods adapt faster, longer ones smooth more.
Visual Toggles:
* Show Oscillator : enables or hides the core histogram.
* Show Moving Average : adds a smoothed overlay for signal confirmation.
* Paint Candles : optional color overlay for chart candles based on oscillator direction.
* Show Static Levels : displays ±0.4 and ±0.5 zones for overbought/oversold boundaries.
How to use it
Trend confirmation: Use midline (0) crossovers as confirmation of emerging trend shifts—cross above 0 suggests a new bullish phase, cross below 0 a bearish one.
Reversal spotting: Look for normalized readings reaching ±0.5 and flattening, or diverging against price extremes.
Divergence analysis: When price makes a new high but the normalized oscillator fails to, it signals waning buying conviction (and vice versa for lows).
Multi-timeframe integration: Works best alongside higher timeframe trend filters or moving averages; normalization makes this consistent.
Alerts
Prebuilt alert conditions allow quick automation:
Midline crossovers (0): transition between accumulation and distribution.
Overbought (+0.4) and Oversold (-0.4) triggers for potential exhaustion.
Signal moving-average crosses for confirmation entries.
Tips for use
Combine with price structure—don’t fade every overbought/oversold reading; confirm with break of structure or candle patterns.
Use longer normalization periods for position trading, shorter for intraday analysis.
In choppy markets, treat 0-line oscillations as noise filters, not trade triggers.
Summary
The Normalised Volume Oscillator modernizes the classic Klinger Volume Oscillator by normalizing its readings into a standardized range. This makes it more adaptive across assets and timeframes, improves interpretability, and provides intuitive, data-driven overbought/oversold levels. Whether used standalone or as a confirmation layer, it offers a clearer view of volume dynamics—revealing when markets are truly being accumulated, distributed, or stretched beyond their sustainable extremes.

PE Fair ValueIn short, it’s an automated fair value estimator based on the price-to-earnings model, with full manual control if TradingView’s fundamental data is missing.
Summary:
1. Lets the user choose the EPS source – either automatically from TradingView fundamentals (EPS TTM) or a manual value.
2. Attempts to fetch the stock’s P/E ratio (TTM) automatically; if unavailable, it uses a manual fallback P/E.
3. Calculates:
Actual P/E = current price ÷ EPS
Fair Value = EPS × chosen (auto/manual) P/E
Percentage difference between market price and fair value
4. Plots the fair-value line on the chart for visual comparison.
5. Displays a table in the top-right corner showing:
EPS used
Target P/E
Actual P/E
Fair value
Current price
Difference vs fair value (colored green or red)
6. Creates alerts when the stock is trading above or below the calculated fair value.
7. Also plots the current closing price for reference.

Top Finder & Dip Hunter [BackQuant]Top Finder & Dip Hunter
A practical tool to map where price is statistically most likely to exhaust or mean-revert. It builds objective support for dips and resistance for tops from multiple methodologies, then filters raw touches with volume, momentum, trend, and price-action context to surface higher-quality reversal opportunities.
What this does
Draws a Dip Support line and a Top Resistance line using the method you select, or a blended hybrid.
Evaluates each touch/penetration against Quality Filters and assigns a 0–100 composite score.
Prints clean DIP and TOP signals only when depth/extension and quality pass your thresholds.
Optionally annotates the chart with the computed quality score at signal time.
Why it’s useful
Objectivity: Converts vague “looks extended” into rules, reduces discretion creep.
Signal hygiene: Filters raw touches using trend, volume, momentum, and candle structure to avoid obvious traps.
Adaptable regimes: Switch methods, sensitivity, and lookbacks to match choppy vs trending conditions.
How support and resistance are built
Pick one per side, or use “Hybrid.”
Dynamic: Anchors to the extreme of a lookback window, padded by recent ATR, so buffers expand in volatile periods and contract when calm.
Fibonacci: Uses the 0.618/0.786 retracement pair inside the current swing window to target common reaction zones.
Volatility: Uses a moving-average basis with standard-deviation bands to capture statistically stretched moves.
Volume-Weighted: Centers off VWAP and penalizes deviations using dispersion of price around VWAP, helpful on intraday instruments.
Hybrid: A weighted average of the above to smooth out single-method biases.
When a touch becomes a signal
Depth/extension test:
Dips must penetrate their support by at least Min Dip Depth % .
Tops must extend above resistance by at least Min Top Rise % .
Quality Score gate: The composite must clear Min Quality Score . Components:
Trend alignment: Favor dips in bullish regimes and tops in bearish regimes using EMAs and RSI.
Volume confirmation: Reward expansion or spikes versus a 20-period baseline.
RSI context: Prefer oversold for dips, overbought for tops.
Momentum shift: Look for short-term momentum turning in the expected direction.
Candle structure: Reward hammer/shooting-star style responses at the level.
How to use it
Pick your regime:
Range/chop, small caps, mean-revert intraday → Volatility or Volume Weighted .
Cleaner swings/trends → Dynamic or Fibonacci .
Unsure or mixed conditions → Hybrid .
Set windows: Start with Lookback = 50 for both sides. Increase in higher timeframes or slow assets, decrease for fast scalps.
Tune sensitivity: Raise Dip/Top Sensitivity to widen buffers and reduce noise. Lower to be more aggressive.
Gate with quality: Begin with Min Quality Score = 60 . Push to 70–80 for cleaner swing entries, relax to 50–60 for scalps.
Act on first prints: The script only fires on new qualified events. Use the score label to prioritize A-setups.
Typical workflows
Intraday futures/crypto: Volume-Weighted or Volatility methods for both sides, higher Sensitivity , require Volume Filter and Momentum Filter on. Look for DIP during opening drive exhaustion and TOP near late-session fatigue.
Swing equities/FX: Dynamic or Fibonacci with moderate sensitivity. Keep Trend Filter on to only take dips above the 200-EMA and tops below it.
Countertrend scouts: Lower Min Dip Depth % / Min Top Rise % slightly, but raise Min Quality Score to compensate.
Reading the chart
Lines: “Dip Support” and “Top Resistance” are the current actionable rails, lightly smoothed to reduce flicker.
Signals: “DIP” prints below bars when a qualified dip appears, “TOP” prints above for qualified tops.
Scores: Optional labels show the composite at signal time. Favor higher numbers, especially when aligned with higher-timeframe trend.
Background hints: Light highlights mark raw touches meeting depth/extension, even if they fail quality. Treat these as early warnings.
Tuning tips
If you get too many false DIP signals in downtrends, raise Min Dip Depth % and keep Trend Filter on.
If tops appear late in squeezes, lower Top Sensitivity slightly or switch top side to Fibonacci .
On assets with erratic volume, prefer Volatility or Dynamic methods and down-weight the Volume Filter .
For strict systems, increase Min Quality Score and require both Volume and Momentum filters.
What this is not
It is not a blind reversal signal. It’s a structured context tool. Combine with your risk plan and higher-timeframe map.
It is not a guarantee of mean reversion. In strong trends, expect fewer, higher-score opportunities and respect invalidation quickly.
Suggested presets
Scalp preset: Lookback 30–40, Sensitivity 1.2–1.5, Quality ≥ 55, Volume & Momentum filters ON.
Swing preset: Lookback 75–100, Sensitivity 1.0–1.2, Quality ≥ 70, Trend & Volume filters ON.
Chop preset: Volatility/Volume-Weighted methods, Quality ≥ 60, Momentum filter ON, RSI emphasis.
Input quick reference
Dip/Top Method: Choose the model for each side or “Hybrid” to blend.
Lookback: Swing window the levels are built from.
Sensitivity: Scales volatility padding around levels.
Min Dip Depth % / Min Top Rise %: Minimum breach/extension to qualify.
Quality Filters: Trend, Volume, Momentum toggles, plus Min Quality Score gate.
Visuals: Colors and whether to print score labels.
Best practices
Map higher-timeframe trend first, then act on lower-timeframe DIP/TOP in the trend’s favor.
Use the score as triage. Skip mediocre prints into news or at session open unless score is exceptional.
Pre-define stop placement relative to the level you used. If a DIP fails, exit on loss of structure rather than waiting for the next print.
Bottom line: Top Finder & Dip Hunter codifies where reversals are most defensible and only flags the ones with supportive context. Tune the method and filters to your market, then let the score keep your playbook disciplined.

Kalman Adaptive Score Overlay [BackQuant]Kalman Adaptive Score Overlay
A powerful indicator that uses adaptive scoring to assess market conditions and trends, utilizing advanced filtering techniques to smooth price data, enhance trend-following precision, and predict future price movements based on past data. It is ideal for traders who need a dynamic and responsive trend analysis tool that adjusts to market fluctuations.
What is Adaptive Scoring?
Adaptive scoring is a technique that adjusts the weight or importance of certain price movements over time based on an ongoing assessment of market behavior. This indicator uses dynamic scoring to assess the strength and direction of price movements, providing insight into whether a trend is likely to continue or reverse. The score is recalculated continuously to reflect the most up-to-date market conditions, offering a responsive approach to trend-following.
How It Works
The core of this indicator is built on advanced filtering methods that smooth price data, adjusting the response to recent price changes. The filtering mechanism incorporates a Kalman filter to reduce noise and improve the accuracy of price signals. Combined with adaptive scoring, this creates a robust framework that automatically adjusts to both short-term fluctuations and long-term trends.
The indicator also uses a dynamic trend-following component that updates its analysis based on the direction of the market, with the option to visualize it through colored candles. When a strong trend is identified, the candles are painted to reflect the prevailing trend, helping traders quickly identify whether the market is in a bullish or bearish state.
Why Adaptive Scoring Is Important
Dynamic Response: Adaptive scoring allows the indicator to respond to changing market conditions. By adjusting its sensitivity to price fluctuations, it ensures that trends are captured accurately, without being overly influenced by short-term noise.
Trend Precision: By combining Kalman filtering with adaptive scoring, the indicator offers a precise and smooth trend-following mechanism. It helps traders stay aligned with the market direction and avoid false signals.
Versatility: The indicator works across multiple timeframes, making it adaptable to different trading strategies, from scalping to long-term trend-following.
Confidence in Market Moves: The adaptive scoring component provides traders with confidence in the strength of the trend, helping them determine when to enter or exit positions with greater certainty.
How Traders Use It
Trend-Following Strategy: Traders can use this indicator to confirm trends and refine their entries and exits. The colored candles and adaptive scoring offer a visual cue of trend strength and direction, making it easier to follow the prevailing market movement.
Multi-Timeframe Analysis: The script supports multi-timeframe analysis, allowing traders to analyze trends and scores across different timeframes (e.g., 1m, 5m, 15m, 30m, 1h, 4h, 12h). This is useful for traders who want to confirm trends on both short and long-term charts before making a trade.
Refining Entry Points: By utilizing the adaptive scoring, traders can identify potential entry points where the score indicates a high probability of trend continuation. Higher scores signal stronger trends, guiding decision-making.
Managing Risk: Traders can use the adaptive scoring system to assess trend stability and adjust their risk management strategies accordingly. For example, higher confidence in the trend allows for larger positions, while lower confidence may require smaller, more cautious trades.
Key Features and Benefits
Kalman Filter for Noise Reduction: The Kalman filter helps to smooth out market noise and allows for a clearer understanding of the underlying price movements. This is particularly useful in volatile markets where short-term fluctuations can cloud trend analysis.
Adaptive Scoring for Flexibility: Adaptive scoring ensures that the indicator remains responsive to changing market conditions. It automatically adjusts to the strength of price movements, enabling better detection of trends and reversals.
Visual Trend Signals: The indicator provides visual signals through candle coloring, making it easier to identify whether the market is in a bullish, neutral, or bearish phase.
Multi-Timeframe Display: The indicator’s multi-timeframe feature allows traders to see the trend and adaptive score on different timeframes simultaneously, providing a comprehensive view of the market.
Customizable Settings: Traders can customize the indicator’s settings, such as the filter parameters, scoring thresholds, and visualization options, tailoring it to their specific trading style and strategy.
Why This is Important for Traders
Improved Decision Making: The adaptive nature of the scoring system allows traders to make more informed decisions based on real-time market data, without being influenced by past volatility.
Market Clarity: By smoothing out price movements and scoring trends adaptively, the indicator provides a clearer picture of market behavior, which is essential for effective trend-following and timing entries and exits.
Increased Confidence in Signals: Adaptive scoring ensures that signals are based on the current market structure, reducing the likelihood of false positives. This boosts traders' confidence when acting on signals.
Conclusion
The Kalman Adaptive Score Overlay offers a dynamic and responsive trend-following tool that integrates Kalman filtering with adaptive scoring. By adjusting to market fluctuations in real time, it allows traders to identify and follow trends with greater precision. Whether you are trading on short or long timeframes, this tool helps you stay aligned with market momentum, ensuring that your entries and exits are based on the most up-to-date and reliable data available.

Machine Learning Moving Average [BackQuant]Machine Learning Moving Average
A powerful tool combining clustering, pseudo-machine learning, and adaptive prediction, enabling traders to understand and react to price behavior across multiple market regimes (Bullish, Neutral, Bearish). This script uses a dynamic clustering approach based on percentile thresholds and calculates an adaptive moving average, ideal for forecasting price movements with enhanced confidence levels.
What is Percentile Clustering?
Percentile clustering is a method that sorts and categorizes data into distinct groups based on its statistical distribution. In this script, the clustering process relies on the percentile values of a composite feature (based on technical indicators like RSI, CCI, ATR, etc.). By identifying key thresholds (lower and upper percentiles), the script assigns each data point (price movement) to a cluster (Bullish, Neutral, or Bearish), based on its proximity to these thresholds.
This approach mimics aspects of machine learning, where we “train” the model on past price behavior to predict future movements. The key difference is that this is not true machine learning; rather, it uses data-driven statistical techniques to "cluster" the market into patterns.
Why Percentile Clustering is Useful
Clustering price data into meaningful patterns (Bullish, Neutral, Bearish) helps traders visualize how price behavior can be grouped over time.
By leveraging past price behavior and technical indicators, percentile clustering adapts dynamically to evolving market conditions.
It helps you understand whether price behavior today aligns with past bullish or bearish trends, improving market context.
Clusters can be used to predict upcoming market conditions by identifying regimes with high confidence, improving entry/exit timing.
What This Script Does
Clustering Based on Percentiles : The script uses historical price data and various technical features to compute a "composite feature" for each bar. This feature is then sorted and clustered based on predefined percentile thresholds (e.g., 10th percentile for lower, 90th percentile for upper).
Cluster-Based Prediction : Once clustered, the script uses a weighted average, cluster momentum, or regime transition model to predict future price behavior over a specified number of bars.
Dynamic Moving Average : The script calculates a machine-learning-inspired moving average (MLMA) based on the current cluster, adjusting its behavior according to the cluster regime (Bullish, Neutral, Bearish).
Adaptive Confidence Levels : Confidence in the predicted return is calculated based on the distance between the current value and the other clusters. The further it is from the next closest cluster, the higher the confidence.
Visual Cluster Mapping : The script visually highlights different clusters on the chart with distinct colors for Bullish, Neutral, and Bearish regimes, and plots the MLMA line.
Prediction Output : It projects the predicted price based on the selected method and shows both predicted price and confidence percentage for each prediction horizon.
Trend Identification : Using the clustering output, the script colors the bars based on the current cluster to reflect whether the market is trending Bullish (green), Bearish (red), or is Neutral (gray).
How Traders Use It
Predicting Price Movements : The script provides traders with an idea of where prices might go based on past market behavior. Traders can use this forecast for short-term and long-term predictions, guiding their trades.
Clustering for Regime Analysis : Traders can identify whether the market is in a Bullish, Neutral, or Bearish regime, using that information to adjust trading strategies.
Adaptive Moving Average for Trend Following : The adaptive moving average can be used as a trend-following indicator, helping traders stay in the market when it’s aligned with the current trend (Bullish or Bearish).
Entry/Exit Strategy : By understanding the current cluster and its associated trend, traders can time entries and exits with higher precision, taking advantage of favorable conditions when the confidence in the predicted price is high.
Confidence for Risk Management : The confidence level associated with the predicted returns allows traders to manage risk better. Higher confidence levels indicate stronger market conditions, which can lead to higher position sizes.
Pseudo Machine Learning Aspect
While the script does not use conventional machine learning models (e.g., neural networks or decision trees), it mimics certain aspects of machine learning in its approach. By using clustering and the dynamic adjustment of a moving average, the model learns from historical data to adjust predictions for future price behavior. The "learning" comes from how the script uses past price data (and technical indicators) to create patterns (clusters) and predict future market movements based on those patterns.
Why This Is Important for Traders
Understanding market regimes helps to adjust trading strategies in a way that adapts to current market conditions.
Forecasting price behavior provides an additional edge, enabling traders to time entries and exits based on predicted price movements.
By leveraging the clustering technique, traders can separate noise from signal, improving the reliability of trading signals.
The combination of clustering and predictive modeling in one tool reduces the complexity for traders, allowing them to focus on actionable insights rather than manual analysis.
How to Interpret the Output
Bullish (Green) Zone : When the price behavior clusters into the Bullish zone, expect upward price movement. The MLMA line will help confirm if the trend remains upward.
Bearish (Red) Zone : When the price behavior clusters into the Bearish zone, expect downward price movement. The MLMA line will assist in tracking any downward trends.
Neutral (Gray) Zone : A neutral market condition signals indecision or range-bound behavior. The MLMA line can help track any potential breakouts or trend reversals.
Predicted Price : The projected price is shown on the chart, based on the cluster's predicted behavior. This provides a useful reference for where the price might move in the near future.
Prediction Confidence : The confidence percentage helps you gauge the reliability of the predicted price. A higher percentage indicates stronger market confidence in the forecasted move.
Tips for Use
Combining with Other Indicators : Use the output of this indicator in combination with your existing strategy (e.g., RSI, MACD, or moving averages) to enhance signal accuracy.
Position Sizing with Confidence : Increase position size when the prediction confidence is high, and decrease size when it’s low, based on the confidence interval.
Regime-Based Strategy : Consider developing a multi-strategy approach where you use this tool for Bullish or Bearish regimes and a separate strategy for Neutral markets.
Optimization : Adjust the lookback period and percentile settings to optimize the clustering algorithm based on your asset’s characteristics.
Conclusion
The Machine Learning Moving Average offers a novel approach to price prediction by leveraging percentile clustering and a dynamically adapting moving average. While not a traditional machine learning model, this tool mimics the adaptive behavior of machine learning by adjusting to evolving market conditions, helping traders predict price movements and identify trends with improved confidence and accuracy.

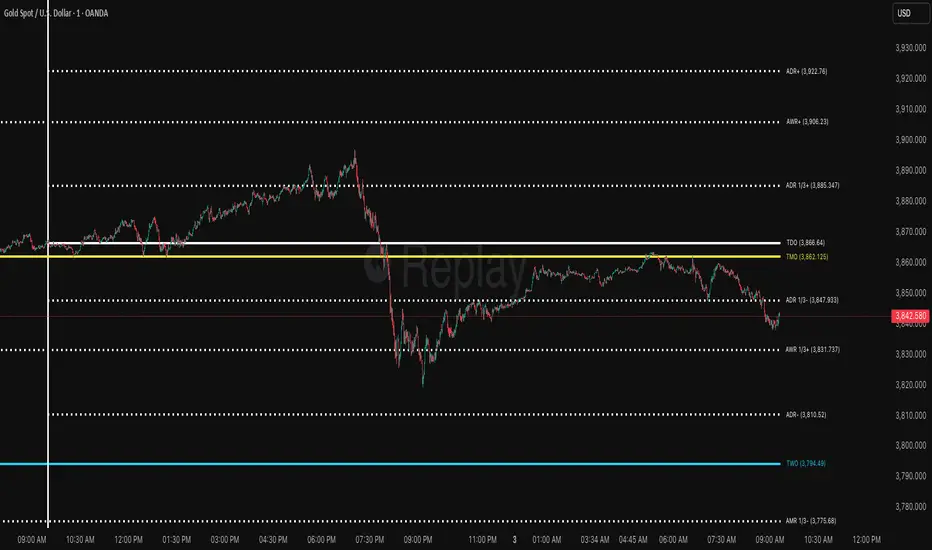
ICT ADR/AWR/AMR Levels | Trade Symmetry🌟 ICT ADR/AWR/AMR Levels
📋 Overview
This advanced technical analysis tool calculates and displays Average Daily Range (ADR), Average Weekly Range (AWR), and Average Monthly Range (AMR) levels. The indicator incorporates smart detection technology that automatically maintains monthly level visibility when historical data becomes unavailable.
✨ Key Features
🕒 Precise Time Alignment
True Daily Opens (TDO) aligned with 00:00 UTC
True Weekly Opens (TWO) at 00:00 UTC (configurable Monday/Sunday start)
True Monthly Opens (TMO) at 00:00 UTC on month start
Customizable period start times and parameters
📊 Comprehensive Multi-Timeframe Analysis
Daily Levels (ADR): Base level with multiple extensions including Fibonacci ratios
Weekly Levels (AWR): Weekly range projections and key levels
Monthly Levels (AMR): Monthly range calculations with automatic fallback system
🔄 Intelligent Level Management
Smart Detection: Automatically switches between historical and current monthly levels
Continuous Visibility: Ensures reference levels remain visible regardless of data availability
Seamless Operation: No manual adjustment needed for level transitions
⚙️ Extensive Customization
Adjustable lookback periods for all timeframes
Independent control over each level type and extension
Complete visual customization (colors, styles, widths)
Flexible labeling and display options
Configurable vertical separation lines
🏷️ Advanced Display Options
Clean, organized label placement
Optional price display in labels
Historical period tracking
Overlapping label merging capability
Adjustable label sizing and positioning
🚀 How to Use
Initial Setup: Enable desired timeframes (Daily/Weekly/Monthly)
Range Configuration: Set appropriate averaging periods for each timeframe
Level Selection: Choose which extension levels to display
Visual Settings: Customize colors and styles to match your trading workspace
Automatic Operation: The indicator intelligently manages level transitions
💡 Practical Applications
Identify potential support and resistance areas across multiple timeframes
Establish realistic profit targets based on historical volatility
Plan trade entries and exits around significant time-based levels
Analyze market volatility patterns across different time horizons
Incorporate institutional trading concepts into your analysis
Daniel.Yer Volume Breakout Signal🧠 Summary – Daniel.Yer Volume Breakout Signal
The indicator only works on time frames of minutes.
An indicator that detects high-volume breakouts after the market opens and highlights potential entry zones.
Based on sampling the opening volume window and comparing it to the session’s volume peak.
Visually marks preparation areas (colored background) and plots BUY/SELL triangles for confirmation candles.
Includes real-time alert conditions for leading tickers: SPY, AAPL, MSFT, META, AMD, TSLA, NVDA, PLTR, GOOG, and AMZN.
Optimized for day trading — provides actionable alerts even when the user is offline.

Multi-Mode Seasonality Map [BackQuant]Multi-Mode Seasonality Map
A fast, visual way to expose repeatable calendar patterns in returns, volatility, volume, and range across multiple granularities (Day of Week, Day of Month, Hour of Day, Week of Month). Built for idea generation, regime context, and execution timing.
What is “seasonality” in markets?
Seasonality refers to statistically repeatable patterns tied to the calendar or clock, rather than to price levels. Examples include specific weekdays tending to be stronger, certain hours showing higher realized volatility, or month-end flow boosting volumes. This tool measures those effects directly on your charted symbol.
Why seasonality matters
It’s orthogonal alpha: timing edges independent of price structure that can complement trend, mean reversion, or flow-based setups.
It frames expectations: when a session typically runs hot or cold, you size and pace risk accordingly.
It improves execution: entering during historically favorable windows, avoiding historically noisy windows.
It clarifies context: separating normal “calendar noise” from true anomaly helps avoid overreacting to routine moves.
How traders use seasonality in practice
Timing entries/exits : If Tuesday morning is historically weak for this asset, a mean-reversion buyer may wait for that drift to complete before entering.
Sizing & stops : If 13:00–15:00 shows elevated volatility, widen stops or reduce size to maintain constant risk.
Session playbooks : Build repeatable routines around the hours/days that consistently drive PnL.
Portfolio rotation : Compare seasonal edges across assets to schedule focus and deploy attention where the calendar favors you.
Why Day-of-Week (DOW) can be especially helpful
Flows cluster by weekday (ETF creations/redemptions, options hedging cadence, futures roll patterns, macro data releases), so DOW often encodes a stable micro-structure signal.
Desk behavior and liquidity provision differ by weekday, impacting realized range and slippage.
DOW is simple to operationalize: easy rules like “fade Monday afternoon chop” or “press Thursday trend extension” can be tested and enforced.
What this indicator does
Multi-mode heatmaps : Switch between Day of Week, Day of Month, Hour of Day, Week of Month .
Metric selection : Analyze Returns , Volatility ((high-low)/open), Volume (vs 20-bar average), or Range (vs 20-bar average).
Confidence intervals : Per cell, compute mean, standard deviation, and a z-based CI at your chosen confidence level.
Sample guards : Enforce a minimum sample size so thin data doesn’t mislead.
Readable map : Color palettes, value labels, sample size, and an optional legend for fast interpretation.
Scoreboard : Optional table highlights best/worst DOW and today’s seasonality with CI and a simple “edge” tag.
How it’s calculated (under the hood)
Per bar, compute the chosen metric (return, vol, volume %, or range %) over your lookback window.
Bucket that metric into the active calendar bin (e.g., Tuesday, the 15th, 10:00 hour, or Week-2 of month).
For each bin, accumulate sum , sum of squares , and count , then at render compute mean , std dev , and confidence interval .
Color scale normalizes to the observed min/max of eligible bins (those meeting the minimum sample size).
How to read the heatmap
Color : Greener/warmer typically implies higher mean value for the chosen metric; cooler implies lower.
Value label : The center number is the bin’s mean (e.g., average % return for Tuesdays).
Confidence bracket : Optional “ ” shows the CI for the mean, helping you gauge stability.
n = sample size : More samples = more reliability. Treat small-n bins with skepticism.
Suggested workflows
Pick the lens : Start with Analysis Type = Returns , Heatmap View = Day of Week , lookback ≈ 252 trading days . Note the best/worst weekdays and their CI width.
Sanity-check volatility : Switch to Volatility to see which bins carry the most realized range. Use that to plan stop width and trade pacing.
Check liquidity proxy : Flip to Volume , identify thin vs thick windows. Execute risk in thicker windows to reduce slippage.
Drill to intraday : Use Hour of Day to reveal opening bursts, lunchtime lulls, and closing ramps. Combine with your main strategy to schedule entries.
Calendar nuance : Inspect Week of Month and Day of Month for end-of-month, options-cycle, or data-release effects.
Codify rules : Translate stable edges into rules like “no fresh risk during bottom-quartile hours” or “scale entries during top-quartile hours.”
Parameter guidance
Analysis Period (Days) : 252 for a one-year view. Shorten (100–150) to emphasize the current regime; lengthen (500+) for long-memory effects.
Heatmap View : Start with DOW for robustness, then refine with Hour-of-Day for your execution window.
Confidence Level : 95% is standard; use 90% if you want wider coverage with fewer false “insufficient data” bins.
Min Sample Size : 10–20 helps filter noise. For Hour-of-Day on higher timeframes, consider lowering if your dataset is small.
Color Scheme : Choose a palette with good mid-tone contrast (e.g., Red-Green or Viridis) for quick thresholding.
Interpreting common patterns
Return-positive but low-vol bins : Favorable drift windows for passive adds or tight-stop trend continuation.
Return-flat but high-vol bins : Opportunity for mean reversion or breakout scalping, but manage risk accordingly.
High-volume bins : Better expected execution quality; schedule size here if slippage matters.
Wide CI : Edge is unstable or sample is thin; treat as exploratory until more data accumulates.
Best practices
Revalidate after regime shifts (new macro cycle, liquidity regime change, major exchange microstructure updates).
Use multiple lenses: DOW to find the day, then Hour-of-Day to refine the entry window.
Combine with your core setup signals; treat seasonality as a filter or weight, not a standalone trigger.
Test across assets/timeframes—edges are instrument-specific and may not transfer 1:1.
Limitations & notes
History-dependent: short histories or sparse intraday data reduce reliability.
Not causal: a hot Tuesday doesn’t guarantee future Tuesday strength; treat as probabilistic bias.
Aggregation bias: changing session hours or symbol migrations can distort older samples.
CI is z-approximate: good for fast triage, not a substitute for full hypothesis testing.
Quick setup
Use Returns + Day of Week + 252d to get a clean yearly map of weekday edge.
Flip to Hour of Day on intraday charts to schedule precise entries/exits.
Keep Show Values and Confidence Intervals on while you calibrate; hide later for a clean visual.
The Multi-Mode Seasonality Map helps you convert the calendar from an afterthought into a quantitative edge, surfacing when an asset tends to move, expand, or stay quiet—so you can plan, size, and execute with intent.

Previous D/W/M HLOCHey traders,
Here's a simple Multi-Timeframe indicator that essentially turns time and price into a box. It'll take the previous high, low, opening price, or closing price from one of the three timeframes of your choice (day, week, or month). For whatever reason I can't get the opening price to function consistently so if you find improvements feel free to let me know, this will help traders who prefer to use opening price over closing price.
Naturally this form of charting is classical and nature and some key figures you could use to study its usage are
- Richard W. Schabacker (1930s)
- Edwards & Magee (1948)
- Peter Brandt
- Stacey Burke (more on the intraday side - typically our preference)
It's usage put plainly:
- Quantifying Accumulation or Distribution
- Revealing Energy Build-Up (Compression)
- Framing Breakouts and False Breakouts
- Structuring Time
- Identifying opportunities to trade a daily, weekly, or monthly range.

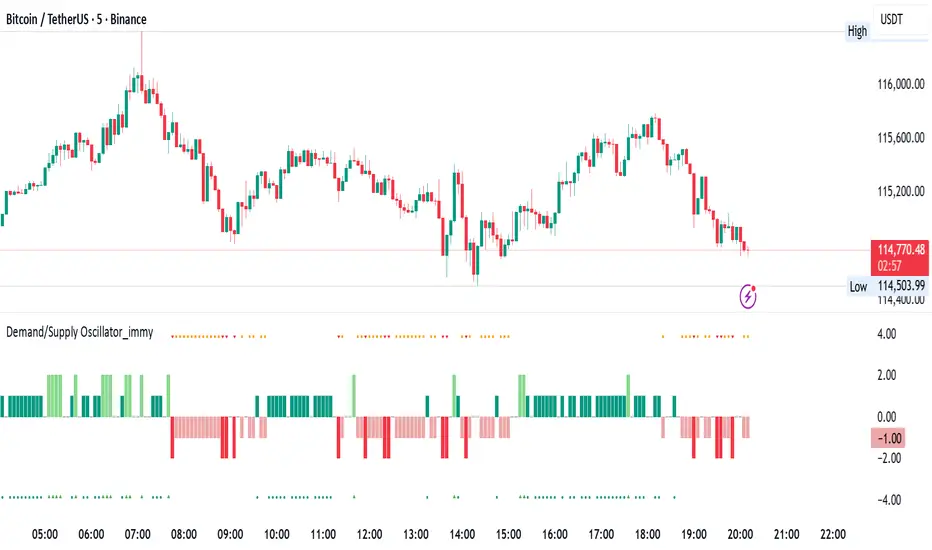
Demand/Supply Oscillator_immyDemand/Supply Oscillator, probably the only D/S oscillator on TV which doesn't draw the lines on the chart but to show you the actual reasons behind the price moves.
Concept Overview
A demand/supply oscillator would aim to look for the hidden spots/order which institutes place in small quantities to not to upset the trend and suddenly place one big order to liquidate the retailers and make a final big move.
The lite color candles in histogram shows the hidden demand/supply which is the reason behind the sudden price pullback, even for short period of time.
Measure demand and supply based on volume, price movement, or candle structure
Identify price waves or impulses (e.g., using fractals, zigzag, or swing high/low logic)
Detect hidden demand/supply (e.g., low volume pullbacks or absorption zones)
Plotted on histogram boxes to visualize strength and direction of each wave
What “Hidden Demand” Means?
Hidden demand refers to buying pressure that isn’t immediately obvious from price action — in other words, buyers are active “behind the scenes” even though the price doesn’t yet show strong upward movement.
What Hidden supply Means?
refers to selling pressure that isn’t obvious yet on the price chart. It means smart money (big players) are quietly selling or distributing positions, even though the price might not be dropping sharply yet.
It usually appears when:
The price is pulling back slightly (down candle),
But volume or an oscillator (like RSI, MACD, or OBV) shows bullish strength (e.g., higher low or positive divergence).
That suggests smart money is accumulating (buying quietly) while the public may think it’s just a normal dip.
💹 Price Reaction — Up or Down?
If there is hidden demand, it’s generally a bullish signal → meaning price is likely to go up afterward.
However, on that exact candle, the price may still be down or neutral, because:
Hidden demand is “hidden” — buyers are absorbing supply quietly.
The move up usually comes after the hidden demand signal, not necessarily on the same candle.
📊 Example
Suppose:
Price makes a slightly lower low,
But RSI makes a higher low → this is bullish (hidden) divergence, or “hidden demand.”
➡️ Interpretation:
Smart buyers are stepping in → next few candles likely move up.
The current candle might still be red or show a small body — that’s okay. The key is the shift in underlying strength.
🧭 Quick Summary
Term Meaning Candle Effect Expected Move After
Hidden Demand Buyers active below surface Candle may still go down or stay flat
Hidden Supply Sellers active behind the scenes Price likely to rise soon
🛠️ Key Components
Best results with Price/Action e.g. Use swing high/low or zigzag to segment price into waves.
Optionally apply fractal logic for more refined wave detection
Combine with other indicators (e.g., RSI, OBV) for confirmation
Include zone strength metrics (e.g., “Power Number” as seen in some indicators)
Demand/Supply Calculation
Demand: Strong bullish candles, increasing volume, breakout zones
Supply: Strong bearish candles, volume spikes on down moves
Hidden Demand/Supply: Pullbacks with low volume or absorption candles
Histogram Visualization
Use plot() or plotshape() to draw histogram bars
Color-code bars: e.g., green for demand, red for supply, lite colors for hidden zones
Add alerts for wave transitions or hidden zone detection
How It Works
Demand/Supply: Detected when price moves strongly with volume spikes.
Hidden Zones: Detected when price moves but volume is low (potential absorption).
Histogram Values:
+2: Strong Demand
+1: Hidden Demand
-1: Hidden Supply
-2: Strong Supply
0: Neutral
Feature Demand (Visible) Hidden Demand
Visibility Clearly seen on price charts Subtle, often masked in consolidation
Participants Retail + Institutional Primarily Institutional
Price Behavior Sharp rallies from zone Sideways movement, low volatility
Tools to Identify Candlestick patterns, support zones Volume profile, order flow, price clusters
Risk/Reward Moderate (widely known) High (less crowded, early entry potential)
Kalman VWAP Filter [BackQuant]Kalman VWAP Filter
A precision-engineered price estimator that fuses Kalman filtering with the Volume-Weighted Average Price (VWAP) to create a smooth, adaptive representation of fair value. This hybrid model intelligently balances responsiveness and stability, tracking trend shifts with minimal noise while maintaining a statistically grounded link to volume distribution.
If you would like to see my original Kalman Filter, please find it here:
Concept overview
The Kalman VWAP Filter is built on two core ideas from quantitative finance and control theory:
Kalman filtering — a recursive Bayesian estimator used to infer the true underlying state of a noisy system (in this case, fair price).
VWAP anchoring — a dynamic reference that weights price by traded volume, representing where the majority of transactions have occurred.
By merging these concepts, the filter produces a line that behaves like a "smart moving average": smooth when noise is high, fast when markets trend, and self-adjusting based on both market structure and user-defined noise parameters.
How it works
Measurement blend : Combines the chosen Price Source (e.g., close or hlc3) with either a Session VWAP or a Rolling VWAP baseline. The VWAP Weight input controls how much the filter trusts traded volume versus price movement.
Kalman recursion : Each bar updates an internal "state estimate" using the Kalman gain, which determines how much to trust new observations vs. the prior state.
Noise parameters :
Process Noise controls agility — higher values make the filter more responsive but also more volatile.
Measurement Noise controls smoothness — higher values make it steadier but slower to adapt.
Filter order (N) : Defines how many parallel state estimates are used. Larger orders yield smoother output by layering multiple one-dimensional Kalman passes.
Final output : A refined price trajectory that captures VWAP-adjusted fair value while dynamically adjusting to real-time volatility and order flow.
Why this matters
Most smoothing techniques (EMA, SMA, Hull) trade off lag for smoothness. Kalman filtering, however, adaptively rebalances that tradeoff each bar using probabilistic weighting, allowing it to follow market state changes more efficiently. Anchoring it to VWAP integrates microstructure context — capturing where liquidity truly lies rather than only where price moves.
Use cases
Trend tracking : Color-coded candle painting highlights shifts in slope direction, revealing early trend transitions.
Fair value mapping : The line represents a continuously updated equilibrium price between raw price action and VWAP flow.
Adaptive moving average replacement : Outperforms static MAs in variable volatility regimes by self-adjusting smoothness.
Execution & reversion logic : When price diverges from the Kalman VWAP, it may indicate short-term imbalance or overextension relative to volume-adjusted fair value.
Cross-signal framework : Use with standard VWAP or other filters to identify convergence or divergence between liquidity-weighted and state-estimated prices.
Parameter guidance
Process Noise : 0.01–0.05 for swing traders, 0.1–0.2 for intraday scalping.
Measurement Noise : 2–5 for normal use, 8+ for very smooth tracking.
VWAP Weight : 0.2–0.4 balances both price and VWAP influence; 1.0 locks output directly to VWAP dynamics.
Filter Order (N) : 3–5 for reactive short-term filters; 8–10 for smoother institutional-style baselines.
Interpretation
When price > Kalman VWAP and slope is positive → bullish pressure; buyers dominate above fair value.
When price < Kalman VWAP and slope is negative → bearish pressure; sellers dominate below fair value.
Convergence of price and Kalman VWAP often signals equilibrium; strong divergence suggests imbalance.
Crosses between Kalman VWAP and the base VWAP can hint at shifts in short-term vs. long-term liquidity control.
Summary
The Kalman VWAP Filter blends statistical estimation with market microstructure awareness, offering a refined alternative to static smoothing indicators. It adapts in real time to volatility and order flow, helping traders visualize balance, transition, and momentum through a lens of probabilistic fair value rather than simple price averaging.

Price–Volume Anomaly DetectorDescription
This indicator identifies unusual relationships between price strength and trading volume. By analyzing expected intraday volume behavior and comparing it with current activity, it highlights potential exhaustion, absorption, or expansion events that may signal changing market dynamics.
How It Works
The script profiles average volume by time of day and compares current volume against this adaptive baseline. Combined with normalized price movement (ATR-based), it detects conditions where price and volume diverge:
Exhaustion: Strong price move on low volume (potential fade)
Absorption: Weak price move on high volume (potential reversal)
Expansion: Strong price move on high volume (momentum continuation)
Key Features
Adaptive time-based volume normalization
Configurable sensitivity thresholds
Optional visibility for each anomaly type
Adjustable label transparency and offset
Light Mode support: label text automatically adjusts for dark or light chart backgrounds
Lightweight overlay design
Inputs Overview
Volume Profile Resolution: Defines time bucket size for expected volume
[* ]Lookback Days: Controls how quickly the profile adapts
Price / Volume Thresholds: Tune anomaly sensitivity
Show Expansion / Exhaustion / Absorption: Toggle specific labels
Label Transparency & Offset: Adjust chart visibility
How to Use:
Apply the indicator to any chart or timeframe.
Observe where labels appear:
🔴 Exhaustion: strong price, weak volume
🔵 Absorption: weak price, strong volume
🟢 Expansion: strong price, strong volume
Use these as context clues, not trade signals — combine with broader volume or trend analysis.
How It Helps
Reveals hidden price–volume imbalances
Highlights areas where momentum may be fading or strengthening
Enhances understanding of market behavior beyond raw price action
⚠️Disclaimer:
This script is provided for educational and informational purposes only. It is not financial advice and should not be considered a recommendation to buy, sell, or hold any financial instrument. Trading involves significant risk of loss and is not suitable for every investor. Users should perform their own due diligence and consult with a licensed financial advisor before making any trading decisions. The author does not guarantee any profits or results from using this script, and assumes no liability for any losses incurred. Use this script at your own risk.

IIR One-Pole Price Filter [BackQuant]IIR One-Pole Price Filter
A lightweight, mathematically grounded smoothing filter derived from signal processing theory, designed to denoise price data while maintaining minimal lag. It provides a refined alternative to the classic Exponential Moving Average (EMA) by directly controlling the filter’s responsiveness through three interchangeable alpha modes: EMA-Length , Half-Life , and Cutoff-Period .
Concept overview
An IIR (Infinite Impulse Response) filter is a type of recursive filter that blends current and past input values to produce a smooth, continuous output. The "one-pole" version is its simplest form, consisting of a single recursive feedback loop that exponentially decays older price information. This makes it both memory-efficient and responsive , ideal for traders seeking a precise balance between noise reduction and reaction speed.
Unlike standard moving averages, the IIR filter can be tuned in physically meaningful terms (such as half-life or cutoff frequency) rather than just arbitrary periods. This allows the trader to think about responsiveness in the same way an engineer or physicist would interpret signal smoothing.
Why use it
Filters out market noise without introducing heavy lag like higher-order smoothers.
Adapts to various trading speeds and time horizons by changing how alpha (responsiveness) is parameterized.
Provides consistent and mathematically interpretable control of smoothing, suitable for both discretionary and algorithmic systems.
Can serve as the core component in adaptive strategies, volatility normalization, or trend extraction pipelines.
Alpha Modes Explained
EMA-Length : Classic exponential decay with alpha = 2 / (L + 1). Equivalent to a standard EMA but exposed directly for fine control.
Half-Life : Defines the number of bars it takes for the influence of a price input to decay by half. More intuitive for time-domain analysis.
Cutoff-Period : Inspired by analog filter theory, defines the cutoff frequency (in bars) beyond which price oscillations are heavily attenuated. Lower periods = faster response.
Formula in plain terms
Each bar updates as:
yₜ = yₜ₋₁ + alpha × (priceₜ − yₜ₋₁)
Where alpha is the smoothing coefficient derived from your chosen mode.
Smaller alpha → smoother but slower response.
Larger alpha → faster but noisier response.
Practical application
Trend detection : When the filter line rises, momentum is positive; when it falls, momentum is negative.
Signal timing : Use the crossover of the filter vs its previous value (or price) as an entry/exit condition.
Noise suppression : Apply on volatile assets or lower timeframes to remove flicker from raw price data.
Foundation for advanced filters : The one-pole IIR serves as a building block for multi-pole cascades, adaptive smoothers, and spectral filters.
Customization options
Alpha Scale : Multiplies the final alpha to fine-tune aggressiveness without changing the mode’s core math.
Color Painting : Candles can be painted green/red by trend direction for visual clarity.
Line Width & Transparency : Adjust the visual intensity to integrate cleanly with your charting style.
Interpretation tips
A smooth yet reactive line implies optimal tuning — minimal delay with reduced false flips.
A sluggish line suggests alpha is too small (increase responsiveness).
A noisy, twitchy line means alpha is too large (increase smoothing).
Half-life tuning often feels more natural for aligning filter speed with price cycles or bar duration.
Summary
The IIR One-Pole Price Filter is a signal smoother that merges simplicity with mathematical rigor. Whether you’re filtering for entry signals, generating trend overlays, or constructing larger multi-stage systems, this filter delivers stability, clarity, and precision control over noise versus lag, an essential tool for any quantitative or systematic trading approach.

Fair Value Lead-Lag Model [BackQuant]Fair Value Lead-Lag Model
A cross-asset model that estimates where price "should" be relative to a chosen reference series, then tracks the deviation as a normalized oscillator. It helps you answer two questions: 1) is the asset rich or cheap vs its driver, and 2) is the driver leading or lagging price over the next N bars.
Concept in one paragraph
Many assets co-move with a macro or sector driver. Think BTC vs DXY, gold vs real yields, a stock vs its sector ETF. This tool builds a rolling fair value of the charted asset from a reference series and shows how far price is above or below that fair value in standard deviation units. You can shift the reference forward or backward to test who leads whom, then use the deviation and its bands to structure mean-reversion or trend-following ideas.
What the model does
Reference mapping : Pulls a reference symbol at a chosen timeframe, with an optional lead or lag in bars to test causality.
Fair value engine : Converts the reference into a synthetic fair value of the chart using one of four methods:
Ratio : price/ref with a rolling average ratio. Good when the relationship is proportional.
Spread : price minus ref with a rolling average spread. Good when the relationship is additive.
Z-Score : normalizes both series, aligns on standardized units, then re-projects to price space. Good when scale drifts.
Beta-Adjusted : rolling regression style. Uses covariance and variance to compute beta, then builds a fair value = mean(price) + beta * (ref − mean(ref)).
Deviation and bands : Computes a z-scored deviation of price vs fair value and plots sigma bands (±1, ±2, ±3) around the fair value line on the chart.
Correlation context : Shows rolling correlation so you can judge if deviations are meaningful or just noise when co-movement is weak.
Visuals :
Fair value line on price chart with sigma envelopes.
Deviation as a column oscillator and optional line.
Threshold shading beyond user-set upper and lower levels.
Summary table with reference, deviation, status, correlation, and method.
Why this is useful
Mean reversion framework : When correlation is healthy and deviation stretches beyond your sigma threshold, probability favors reversion toward fair value. This is classic pairs logic adapted to a driver and a target.
Trend confirmation : If price rides the fair value line and deviation stays modest while correlation is positive, it supports trend persistence. Pullbacks to negative deviation in an uptrend can be buyable.
Lead-lag discovery : Shift the reference forward by +N bars. If correlation improves, the reference tends to lead. Shift backward for the reverse. Use the best setting for planning early entries or hedges.
Regime detection : Large persistent deviations with falling correlation hint at regime change. The relationship you relied on may be breaking down, so reduce confidence or switch methods.
How to use it step by step
Pick a sensible reference : Choose a macro, index, currency, or sector driver that logically explains the asset’s moves. Example: gold with DXY, a semiconductor stock with SOXX.
Test lead-lag : Nudge Lead/Lag Periods to small positive values like +1 to +5 to see if the reference leads. If correlation improves, keep that offset. If correlation worsens, try a small negative value or zero.
Select a method :
Start with Beta-Adjusted when the relationship is approximately linear with drift.
Use Ratio if the assets usually move in proportional terms.
Use Spread when they trade around a level difference.
Use Z-Score when scales wander or volatility regimes shift.
Tune windows :
Rolling Window controls how quickly fair value adapts. Shorter equals faster but noisier.
Normalization Period controls how deviations are standardized. Longer equals stabler sigma sizing.
Correlation Length controls how co-movement is measured. Keep it near the fair value window.
Trade the edges :
Mean reversion idea : Wait for deviation beyond your Upper or Lower Threshold with positive correlation. Fade back toward fair value. Exit at the fair value line or the next inner sigma band.
Trend idea : In an uptrend, buy pullbacks when deviation dips negative but correlation remains healthy. In a downtrend, sell bounces when deviation spikes positive.
Read the table : Deviation shows how many sigmas you are from fair value. Status tells you overvalued or undervalued. Correlation color hints confidence. Method tells you the projection style used.
Reading the display
Fair value line on price chart: the model’s estimate of where price should trade given the reference, updated each bar.
Sigma bands around fair value: a quick sense of residual volatility. Reversions often target inner bands first.
Deviation oscillator : above zero means rich vs fair value, below zero means cheap. Color bins intensify with distance.
Correlation line (optional): scale is folded to match thresholds. Higher values increase trust in deviations.
Parameter tips
Start with Rolling Window 20 to 30, Normalization Period 100, Correlation Length 50.
Upper and Lower Threshold at ±2.0 are classic. Tighten to ±1.5 for more signals or widen to ±2.5 to focus on outliers.
When correlation drifts below about 0.3, treat deviations with caution. Consider switching method or reference.
If the fair value line whipsaws, increase Rolling Window or move to Beta-Adjusted which tends to be smoother.
Playbook examples
Pairs-style reversion : Asset is +2.3 sigma rich vs reference, correlation 0.65, trend flat. Short the deviation back toward fair value. Cover near the fair value line or +1 sigma.
Pro-trend pullback : Uptrend with correlation 0.7. Deviation dips to −1.2 sigma while price sits near the −1 sigma band. Buy the dip, target the fair value line, trail if the line is rising.
Lead-lag timing : Reference leads by +3 bars with improved correlation. Use reference swings as early cues to anticipate deviation turns on the target.
Caveats
The model assumes a stable relationship over the chosen windows. Structural breaks, policy shocks, and index rebalances can invalidate recent history.
Correlation is descriptive, not causal. A strong correlation does not guarantee future convergence.
Do not force trades when the reference has low liquidity or mismatched hours. Use a reference timeframe that captures real overlap.
Bottom line
This tool turns a loose cross-asset intuition into a quantified, visual fair value map. It gives you a consistent way to find rich or cheap conditions, time mean-reversion toward a statistically grounded target, and confirm or fade trends when the driver agrees.

VWAP Entry Assistant (v1.0)Description:
Anchored VWAP with a lightweight assistant for VWAP reversion trades.
It shows the distance to VWAP, an estimated hit probability for the current bar, the expected number of bars to reach VWAP, and a recommended entry price.
If the chance of touching VWAP is low, the script suggests an adjusted limit using a fraction of ATR.
The VWAP line is white by default, and a compact summary table appears at the bottom-left.
Educational tool. Not financial advice. Not affiliated with TradingView or any exchange. Always backtest before use.

Volume Cluster Heatmap [BackQuant]Volume Cluster Heatmap
A visualization tool that maps traded volume across price levels over a chosen lookback period. It highlights where the market builds balance through heavy participation and where it moves efficiently through low-volume zones. By combining a heatmap, volume profile, and high/low volume node detection, this indicator reveals structural areas of support, resistance, and liquidity that drive price behavior.
What Are Volume Clusters?
A volume cluster is a horizontal aggregation of traded volume at specific price levels, showing where market participants concentrated their buying and selling.
High Volume Nodes (HVN) : Price levels with significant trading activity; often act as support or resistance.
Low Volume Nodes (LVN) : Price levels with little trading activity; price moves quickly through these areas, reflecting low liquidity.
Volume clusters help identify key structural zones, reveal potential reversals, and gauge market efficiency by highlighting where the market is balanced versus areas of thin liquidity.
By creating heatmaps, profiles, and highlighting high and low volume nodes (HVNs and LVNs), it allows traders to see where the market builds balance and where it moves efficiently through thin liquidity zones.
Example: Bitcoin breaking away from the high-volume zone near 118k and moving cleanly through the low-volume pocket around 113k–115k, illustrating how markets seek efficiency:
Core Features
Visual Analysis Components:
Heatmap Display : Displays volume intensity as colored boxes, lines, or a combination for a dynamic view of market participation.
Volume Profile Overlay : Shows cumulative volume per price level along the right-hand side of the chart.
HVN & LVN Labels : Marks high and low volume nodes with color-coded lines and labels.
Customizable Colors & Transparency : Adjust high and low volume colors and minimum transparency for clear differentiation.
Session Reset & Timeframe Control : Dynamically resets clusters at the start of new sessions or chosen timeframes (intraday, daily, weekly).
Alerts
HVN / LVN Alerts : Notify when price reaches a significant high or low volume node.
High Volume Zone Alerts : Trigger when price enters the top X% of cumulative volume, signaling key areas of market interest.
How It Works
Each bar’s volume is distributed proportionally across the horizontal price levels it touches. Over the lookback period, this builds a cumulative volume profile, identifying price levels with the most and least trading activity. The highest cumulative volume levels become HVNs, while the lowest are LVNs. A side volume profile shows aggregated volume per level, and a heatmap overlay visually reinforces market structure.
Applications for Traders
Identify strong support and resistance at HVNs.
Detect areas of low liquidity where price may move quickly (LVNs).
Determine market balance zones where price may consolidate.
Filter noise: because volume clusters aggregate activity into levels, minor fluctuations and irrelevant micro-moves are removed, simplifying analysis and improving strategy development.
Combine with other indicators such as VWAP, Supertrend, or CVD for higher-probability entries and exits.
Use volume clusters to anticipate price reactions to breaking points in thin liquidity zones.
Advanced Display Options
Heatmap Styles : Boxes, lines, or both. Boxes provide a traditional heatmap, lines are better for high granularity data.
Line Mode Example : Simplified line visualization for easier reading at high level counts:
Profile Width & Offset : Adjust spacing and placement of the volume profile for clarity alongside price.
Transparency Control : Lower transparency for more opaque visualization of high-volume zones.
Best Practices for Usage
Reduce the number of levels when using line mode to avoid clutter.
Use HVN and LVN markers in conjunction with volume profiles to plan entries and exits.
Apply session resets to monitor intraday vs. multi-day volume accumulation.
Combine with other technical indicators to confirm high-probability trading signals.
Watch price interactions with LVNs for potential rapid movements and with HVNs for possible support/resistance or reversals.
Technical Notes
Each bar contributes volume proportionally to the price levels it spans, creating a dynamic and accurate representation of traded interest.
Volume profiles are scaled and offset for visual clarity alongside live price.
Alerts are fully integrated for HVN/LVN interaction and high-volume zone entries.
Optimized to handle large lookback windows and numerous price levels efficiently without performance degradation.
This indicator is ideal for understanding market structure, detecting key liquidity areas, and filtering out noise to model price more accurately in high-frequency or algorithmic strategies.

Cumulative Volume Delta Z Score [BackQuant]Cumulative Volume Delta Z Score
The Cumulative Volume Delta Z Score indicator is a sophisticated tool that combines the cumulative volume delta (CVD) with Z-Score normalization to provide traders with a clearer view of market dynamics. By analyzing volume imbalances and standardizing them through a Z-Score, this tool helps identify significant price movements and market trends while filtering out noise.
Core Concept of Cumulative Volume Delta (CVD)
Cumulative Volume Delta (CVD) is a popular indicator that tracks the net difference between buying and selling volume over time. CVD helps traders understand whether buying or selling pressure is dominating the market. Positive CVD signals buying pressure, while negative CVD indicates selling pressure.
The addition of Z-Score normalization to CVD makes it easier to evaluate whether current volume imbalances are unusual compared to past behavior. Z-Score helps in detecting extreme conditions by showing how far the current CVD is from its historical mean in terms of standard deviations.
Key Features
Cumulative Volume Delta (CVD): Tracks the net buying vs. selling volume, allowing traders to gauge the overall market sentiment.
Z-Score Normalization: Converts CVD into a standardized value to highlight extreme movements in volume that are statistically significant.
Divergence Detection: The indicator can spot bullish and bearish divergences between price and CVD, which can signal potential trend reversals.
Pivot-Based Divergence: Identifies price and CVD pivots, highlighting divergence patterns that are crucial for predicting price changes.
Trend Analysis: Colors bars according to trend direction, providing a visual indication of bullish or bearish conditions based on Z-Score.
How It Works
Cumulative Volume Delta (CVD): The CVD is calculated by summing the difference between buying and selling volume for each bar. It represents the net buying or selling pressure, giving insights into market sentiment.
Z-Score Normalization: The Z-Score is applied to the CVD to normalize its values, making it easier to compare current conditions with historical averages. A Z-Score greater than 0 indicates a bullish market, while a Z-Score less than 0 signals a bearish market.
Divergence Detection: The indicator detects regular and hidden bullish and bearish divergences between price and CVD. These divergences often precede trend reversals, offering traders a potential entry point.
Pivot-Based Analysis: The indicator uses pivot highs and lows in both price and CVD to identify divergence patterns. A bullish divergence occurs when price makes a lower low, but CVD fails to follow, suggesting weakening selling pressure. Conversely, a bearish divergence happens when price makes a higher high, but CVD doesn't confirm the move, indicating potential selling pressure.
Trend Coloring: The bars are colored based on the trend direction. Green bars indicate an uptrend (CVD is positive), and red bars indicate a downtrend (CVD is negative). This provides an easy-to-read visualization of market conditions.
Standard Deviation Levels: The indicator plots ±1σ, ±2σ, and ±3σ levels to indicate the degree of deviation from the average CVD. These levels act as thresholds for identifying extreme buying or selling pressure.
Customization Options
Anchor Timeframe: The user can define an anchor timeframe to aggregate the CVD, which can be customized based on the trader’s needs (e.g., daily, weekly, custom lower timeframes).
Z-Score Period: The period for calculating the Z-Score can be adjusted, allowing traders to fine-tune the indicator's sensitivity.
Divergence Detection: The tool offers controls to enable or disable divergence detection, with the ability to adjust the lookback periods for pivot detection.
Trend Coloring and Visuals: Traders can choose whether to color bars based on trend direction, display standard deviation levels, or visualize the data as a histogram or line plot.
Display Options: The indicator also allows for various display options, including showing the Z-Score values and divergence signals, with customizable colors and line widths.
Alerts and Signals
The Cumulative Volume Delta Z Score comes with pre-configured alert conditions for:
Z-Score Crossovers: Alerts are triggered when the Z-Score crosses the 0 line, indicating a potential trend reversal.
Shifting Trend: Alerts for when the Z-Score shifts direction, signaling a change in market sentiment.
Divergence Detection: Alerts for both regular and hidden bullish and bearish divergences, offering potential reversal signals.
Extreme Imbalances: Alerts when the Z-Score reaches extreme positive or negative levels, indicating overbought or oversold market conditions.
Applications in Trading
Trend Identification: Use the Z-Score to confirm bullish or bearish trends based on cumulative volume data, filtering out noise and false signals.
Reversal Signals: Divergences between price and CVD can help identify potential trend reversals, making it a powerful tool for swing traders.
Volume-Based Confirmation: The Z-Score allows traders to confirm price movements with volume data, providing more reliable signals compared to price action alone.
Divergence Strategy: Use the divergence signals to identify potential points of entry, particularly when regular or hidden divergences appear.
Volatility and Market Sentiment: The Z-Score provides insights into market volatility by measuring the deviation of CVD from its historical mean, helping to predict price movement strength.
The Cumulative Volume Delta Z Score is a powerful tool that combines volume analysis with statistical normalization. By focusing on volume imbalances and applying Z-Score normalization, this indicator provides clear, reliable signals for trend identification and potential reversals. It is especially useful for filtering out market noise and ensuring that trades are based on significant price movements driven by substantial volume changes.
This indicator is perfect for traders looking to add volume-based analysis to their strategy, offering a more robust and accurate way to gauge market sentiment and trend strength.

Volume Sampled Supertrend [BackQuant]Volume Sampled Supertrend
A Supertrend that runs on a volume sampled price series instead of fixed time. New synthetic bars are only created after sufficient traded activity, which filters out low participation noise and makes the trend much easier to read and model.
Original Script Link
This indicator is built on top of my volume sampling engine. See the base implementation here:
Why Volume Sampling
Traditional charts print a bar every N minutes regardless of how active the tape is. During quiet periods you accumulate many small, low information bars that add noise and whipsaws to downstream signals.
Volume sampling replaces the clock with participation. A new synthetic bar is created only when a pre-set amount of volume accumulates (or, in Dollar Bars mode, when pricevolume reaches a dollar threshold). The result is a non-uniform time series that stretches in busy regimes and compresses in quiet regimes. This naturally:
filters dead time by skipping low volume chop;
standardizes the information content per bar, improving comparability across regimes;
stabilizes volatility estimates used inside banded indicators;
gives trend and breakout logic cleaner state transitions with fewer micro flips.
What this tool does
It builds a synthetic OHLCV stream from volume based buckets and then applies a Supertrend to that synthetic price. You are effectively running Supertrend on a participation clock rather than a wall clock.
Core Features
Sampling Engine - Choose Volume buckets or Dollar Bars . Thresholds can be dynamic from a rolling mean or median, or fixed by the user.
Synthetic Candles - Plots the volume sampled OHLC candles so you can visually compare against regular time candles.
Supertrend on Synthetic Price - ATR bands and direction are computed on the sampled series, not on time bars.
Adaptive Coloring - Candle colors can reflect side, intensity by volume, or a neutral scheme.
Research Panels - Table shows total samples, current bucket fill, threshold, bars-per-sample, and synthetic return stats.
Alerts - Long and Short triggers on Supertrend direction flips for the synthetic series.
How it works
Sampling
Pick Sampling Method = Volume or Dollar Bars.
Set the dynamic threshold via Rolling Lookback and Filter (Mean or Median), or enable Use Fixed and type a constant.
The script accumulates volume (or pricevolume) each time bar. When the bucket reaches the threshold, it finalizes one or more synthetic candles and resets accumulation.
Each synthetic candle stores its own OHLCV and is appended to the synthetic series used for all downstream logic.
Supertrend on the sampled stream
Choose Supertrend Source (Open, High, Low, Close, HLC3, HL2, OHLC4, HLCC4) derived from the synthetic candle.
Compute ATR over the synthetic series with ATR Period , then form upperBand = src + factorATR and lowerBand = src - factorATR .
Apply classic trailing band and direction rules to produce Supertrend and trend state.
Because bars only come when there is sufficient participation, band touches and flips tend to align with meaningful pushes, not idle prints.
Reading the display
Synthetic Volume Bars - The non-uniform candles that represent equal information buckets. Expect more candles during active sessions and fewer during lulls.
Volume Sampled Supertrend - The main line. Green when Trend is 1, red when Trend is -1.
Markers - Small dots appear when a new synthetic sample is created, useful for aligning activity cycles.
Time Bars Overlay (optional) - Plot regular time candles to compare how the synthetic stream compresses quiet chop.
Settings you will use most
Data Settings
Sampling Method - Volume or Dollar Bars.
Rolling Lookback and Filter - Controls the dynamic threshold. Median is robust to outliers, Mean is smoother.
Use Fixed and Fixed Threshold - Force a constant bucket size for consistent sampling across regimes.
Max Stored Samples - Ring buffer limit for performance.
Indicator Settings
SMA over last N samples - A moving average computed on the synthetic close series. Can be hidden for a cleaner layout.
Supertrend Source - Price field from the synthetic candle.
ATR Period and Factor - Standard Supertrend controls applied on the synthetic series.
Visuals and UI
Show Synthetic Bars - Turn synthetic candles on or off.
Candle Color Mode - Green/Red, Volume Intensity, Neutral, or Adaptive.
Mark new samples - Puts a dot when a bucket closes.
Show Time Bars - Overlay regular candles for comparison.
Paint candles according to Trend - Colors chart candles using current synthetic Supertrend direction.
Line Width , Colors , and Stats Table toggles.
Some workflow notes:
Trend Following
Set Sampling Method = Volume, Filter = Median, and a reasonable Rolling Lookback so busy regimes produce more samples.
Trade in the direction of the Volume Sampled Supertrend. Because flips require real participation, you tend to avoid micro whipsaws seen on time bars.
Use the synthetic SMA as a bias rail and trailing reference for partials or re-entries.
Breakout and Continuation
Watch for rapid clustering of new sample markers and a clean flip of the synthetic Supertrend.
The compression of quiet time and expansion in busy bursts often makes breakouts more legible than on uniform time charts.
Mean Reversion
In instruments that oscillate, faded moves against the synthetic Supertrend are easier to time when the bucket cadence slows and Supertrend flattens.
Combine with the synthetic SMA and return statistics in the table for sizing and expectation setting.
Stats table (top right)
Method and Total Samples - Sampling regime and current synthetic history length.
Current Vol or Dollar and Threshold - Live bucket fill versus the trigger.
Bars in Bucket and Avg Bars per Sample - How much time data each synthetic bar tends to compress.
Avg Return and Return StdDev - Simple research metrics over synthetic close-to-close changes.
Why this reduces noise
Time based bars treat a 5 minute print with 1 percent of average participation the same as one with 300 percent. Volume sampling equalizes bar information content. By advancing the bar only when sufficient activity occurs, you skip low quality intervals that add variance but little signal. For banded systems like Supertrend, this often means fewer false flips and cleaner runs.
Notes and tips
Use Dollar Bars on assets where nominal price varies widely over time or across symbols.
Median filter can resist single burst outliers when setting dynamic thresholds.
If you need a stable research baseline, set Use Fixed and keep the threshold constant across tests.
Enable Show Time Bars occasionally to sanity check what the synthetic stream is compressing or stretching.
Link again for reference
Original Volume Based Sampling engine:
Bottom line
When you let participation set the clock, your Supertrend reacts to meaningful flow instead of idle prints. The result is a cleaner state machine, fewer micro whipsaws, and a trend read that respects when the market is actually trading.

Volume x Close in CroresThis indicator provides a clear visualization of the monetary volume activity for each candle by calculating the product of trading volume and closing price and converting it into crores for easier readability.

Cumulative Volume Delta Profile and Heatmap [BackQuant]Cumulative Volume Delta Profile and Heatmap
A multi-view CVD workstation that measures buying vs selling pressure, renders a price-aligned CVD profile with Point of Control, paints an optional heatmap of delta intensity, and detects classical CVD divergences using pivot logic. Built for reading who is in control, where participation clustered, and when effort is failing to produce result.
What is CVD
Cumulative Volume Delta accumulates the difference between aggressive buys and aggressive sells over time. When CVD rises, buyers are lifting the offer more than sellers are hitting the bid. When CVD falls, the opposite is true. Plotting CVD alongside price helps you judge whether price moves are supported by real participation or are running on fumes.
Core Features
Visual Analysis Components
CVD Columns - Plot of cumulative delta, colored by side, for quick read of participation bias.
CVD Profile - Price-aligned histogram of CVD accumulation using user-set bins. Shows where net initiative clustered.
Split Buy and Sell CVD - Optional two-sided profile that separates positive and negative CVD into distinct wings.
POC - Point of Control - The price level with the highest absolute CVD accumulation, labeled and line-marked.
Heatmap - Semi-transparent blocks behind price that encode CVD intensity across the last N bars.
Divergence Engine - Pivot-based detection of Bearish and Bullish CVD divergences with optional lines and labels.
Stats Panel - Top level metrics: Total CVD, Buy and Sell totals with percentages, Delta Ratio, and current POC price.
How it works
Delta source and sampling
You select an Anchor Timeframe that defines the higher time aggregation for reading the trend of CVD.
The script pulls lower timeframe volume delta and aggregates it to the anchor window. You can let it auto-select the lower timeframe or force a custom one.
CVD is then accumulated bar by bar to form a running total. This plot shows the direction and persistence of initiative.
Profile construction
The recent price range is split into Profile Granularity bins.
As price traverses a bin, the current delta contribution is added to that bin.
If Split Buy and Sell CVD is enabled, positive CVD goes to the right wing and negative CVD to the left wing.
Widths are scaled by each side’s maximum so you can compare distribution shape at a glance.
The Point of Control is the bin with the highest absolute CVD. This marks where initiative concentrated the most.
Heatmap
For each bin, the script computes intensity as absolute CVD relative to the maximum bin value.
Color is derived from the side in control in that bin and shaded by intensity.
Heatmap Length sets how far back the panels extend, highlighting recurring participation zones.
Divergence model
You define pivot sensitivity with Pivot Left and Right .
Bearish divergence triggers when price confirms a higher high while CVD fails to make a higher high within a configurable Delta Tolerance .
Bullish divergence triggers when price confirms a lower low while CVD fails to make a lower low.
On trigger, optional link lines and labels are drawn at the pivots for immediate context.
Key Settings
Delta Source
Anchor Timeframe - Higher TF for the CVD narrative.
Custom Lower TF and Lower Timeframe - Force the sampling TF if desired.
Pivot Logic
Pivot Left and Right - Bars to each side for swing confirmation.
Delta Tolerance - Small allowance to avoid near-miss false positives.
CVD Profile
Show CVD Profile - Toggle profile rendering.
Split Buy and Sell CVD - Two-sided profile for clearer side attribution.
Show Heatmap - Project intensity panels behind price.
Show POC and POC Color - Mark the dominant CVD node.
Profile Granularity - Number of bins across the visible price range.
Profile Offset and Profile Width - Position and scale the profile.
Profile Position - Right, Left, or Current bar alignment.
Visuals
Bullish Div Color and Bearish Div Color - Colors for divergence artifacts.
Show Divergence Lines and Labels - Visualize pivots and annotations.
Plot CVD - Column plot of total CVD.
Show Statistics and Position - Toggle and place the summary table.
Reading the display
CVD columns
Rising CVD confirms buyers are in control. Falling CVD confirms sellers.
Flat or choppy CVD during wide price moves hints at passive or exhausted participation.
CVD profile wings
Thick right wing near a price zone implies heavy buy initiative accumulated there.
Thick left wing implies heavy sell initiative.
POC marks the strongest initiative node. Expect reactions on first touch and rotations around this level when the tape is balanced.
Heatmap
Brighter blocks indicate stronger historical net initiative at that price.
Stacked bright bands form CVD high volume nodes. These often behave like magnets or shelves for future trade.
Divergences
Bearish - Price prints a higher high while CVD fails to do so. Effort is not producing result. Potential fade or pause.
Bullish - Price prints a lower low while CVD fails to do so. Capitulation lacks initiative. Potential bounce or reversal.
Stats panel
Total CVD - Net initiative over the window.
Buy and Sell volume with percentages - Side composition.
Delta Ratio - Buy over Sell. Values above 1 favor buyers, below 1 favor sellers.
POC Price - Current control node for plan and risk.
Workflows
Trend following
Choose an Anchor Timeframe that matches your holding period.
Trade in the direction of CVD slope while price holds above a bullish POC or below a bearish POC.
Use pullbacks to CVD nodes on your profile as entry locations.
Trend weakens when price makes new highs but CVD stalls, or new lows while CVD recovers.
Mean reversion
Look for divergences at or near prior CVD nodes, especially the POC.
Fade tests into thick wings when the side that dominated there now fails to push CVD further.
Target rotations back toward the POC or the opposite wing edge.
Liquidity and execution map
Treat strong wings and heatmap bands as probable passive interest zones.
Expect pauses, partial fills, or flips at these shelves.
Stops make sense beyond the far edge of the active wing supporting your idea.
Alerts included
CVD Bearish Divergence and CVD Bullish Divergence.
Price Cross Above POC and Price Cross Below POC.
Extreme Buy Imbalance and Extreme Sell Imbalance from Delta Ratio.
CVD Turn Bullish and CVD Turn Bearish when net CVD crosses zero.
Price Near POC proximity alert.
Best practices
Use a higher Anchor Timeframe to stabilize the CVD story and a sensible Profile Granularity so wings are readable without clutter.
Keep Split mode on when you want to separate initiative attribution. Turn it off when you prefer a single net profile.
Tune Pivot Left and Right by instrument to avoid overfitting. Larger values find swing divergences. Smaller values find micro fades.
If volume is thin or synthetic for the symbol, CVD will be less reliable. The script will warn if volume is zero.
Trading applications
Context - Confirm or question breakouts with CVD slope.
Location - Build entries at CVD nodes and POC.
Timing - Use divergence and POC crosses for triggers.
Risk - Place stops beyond the opposite wing or outside the POC shelf.
Important notes and limits
This is a price and volume based study. It does not access off-book or venue-level order flow.
CVD profiles are built from the data available on your chart and the chosen lower timeframe sampling.
Like all volume tools, readings can distort during roll periods, holidays, or feed anomalies. Validate on your instrument.
Technical notes
Delta is aggregated from a lower timeframe into an Anchor Timeframe narrative.
Profile bins update in real time. Splitting by side scales each wing independently so both are readable in the same panel.
Divergences are confirmed using standard pivot definitions with user-set tolerances.
All profile drawing uses fixed X offsets so panels and POC do not swim when you scroll.
Quick start
Anchor Timeframe = Daily for intraday context.
Split Buy and Sell CVD = On.
Profile Granularity = 100 to 200, Profile Position = Right, Width to taste.
Pivot Left and Right around 8 to 12 to start, then adapt.
Turn on Heatmap for a fast map of interest bands.
Bottom line
CVD tells you who is doing the lifting. The profile shows where they did it. Divergences tell you when effort stops paying. Put them together and you get a clear read on control, location, and timing for both trend and mean reversion.

Stop Loss and TargetsEnter your purchase price, SL% and up to 3x TP%s. Automatically plots them on your chart to enable quicker set up of alerts.
